There are times when the market presents you with a puzzle box. On the surface, it looks like every other company filing, every other stock chart. But the closer you look, the more the numbers seem to contradict each other, as if the data itself is hiding the mechanism. You feel like you’ve been served one of those web error pages: Access to this page has been denied. The information is technically there, but it’s not telling you the story you need to hear.
This is the distinct feeling I get when looking at the current state of MicroStrategy (MSTR). The company is, by its own description, in the business of software. It has revenues, it has earnings reports, and it has analyst ratings. But treating it as such is a fundamental category error. The latest batch of consensus estimates paints a picture so disjointed, so internally inconsistent, that it begs the question of whether the standard analytical toolkit is even applicable here. The data isn't lying, but it's speaking a language the models weren't designed to understand.
The Stagnant Core
Let’s begin where any traditional analysis would: the core business. Strip away all the noise, and what do you have? A business software company. The consensus estimate for quarterly revenue is calling for $118.2 million. This represents a year-over-year increase of just 1.84%. The projection for the entire year is even less inspiring, with revenue expected to hit $466.75 million, a change of only 0.71% from the prior year.
Let’s be precise. We’re talking about growth that barely outpaces inflation, if at all. For a company in the tech sector, these are not growth numbers; they are maintenance numbers. They suggest a mature, perhaps even stagnant, enterprise product line that has found its niche and is now defending it. There's nothing inherently wrong with that, but it's not the profile of a stock that experiences the kind of volatility MSTR does.
This is the part of the report that I find genuinely puzzling. Analysts are putting the company's operational performance under a microscope, projecting single-digit percentage changes, while the stock itself swings wildly on factors that have absolutely nothing to do with software sales. The market is pricing this company based on an entirely different set of variables, yet the financial analysis industry continues to run the old playbook. It’s like using a highly sensitive thermometer to measure the speed of a car. The tool is precise, but it's measuring the wrong metric entirely.
A Tale of Two Forecasts
The real tell, the glaring red light on the dashboard, is in the earnings per share (EPS) forecasts. Here, the data doesn't just suggest a different story; it presents two completely contradictory narratives. For the upcoming quarter, analysts project an EPS of -$0.11. This is presented as a 92.95% increase from the same quarter last year. A smaller loss is, of course, a positive development. It suggests improved efficiency, better margins, or some other operational gain. A conventional reading would see this as a sign of a turnaround.
But then you look at the forecast for the entire year. The consensus estimate is for an EPS of -$15.73. This represents a change of -134.08% from the previous year. To be clear, that means the annual loss per share is expected to more than double.
How can these two facts coexist? How can a company be on track for a massive quarterly earnings improvement while simultaneously heading for a catastrophic annual collapse in earnings? Is the core software business expected to suddenly hemorrhage cash in the other three quarters? The numbers, when viewed through a traditional lens, make no logical sense. The discrepancy is too vast to be explained by seasonality or minor operational shifts.
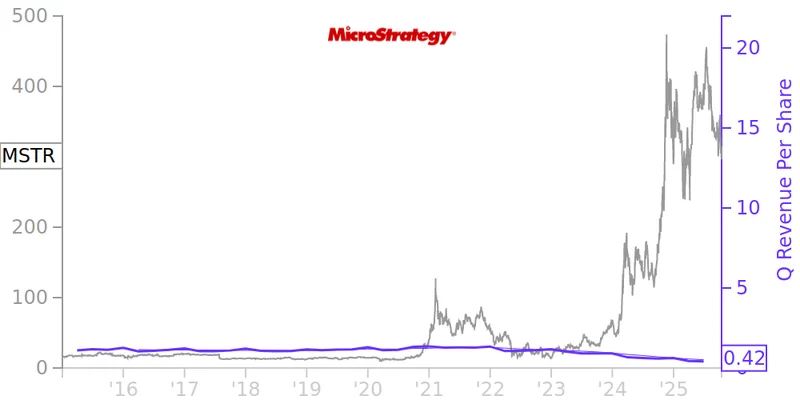
The answer, of course, is that the software business has very little to do with these figures. The driver of these wild swings is the company’s primary strategy: holding Bitcoin on its balance sheet (now over 200,000 BTC). The accounting rules for digital assets can force massive, non-cash impairment charges when the price of the asset falls, which can decimate reported earnings. Conversely, changes in those rules or the price of the asset can have the opposite effect. The quarterly and annual forecasts aren't telling a story about software; they're reflecting different assumptions about the price of Bitcoin and its arcane accounting treatment. The company isn't being run for profit; it's being run as a de facto Bitcoin ETF.
The Zacks Rank of #3 (Hold) is perhaps the most telling detail of all. It’s a perfectly neutral, algorithmically generated conclusion based on inputs that are fundamentally misaligned with the asset's actual value driver. What does a "Hold" recommendation even mean for an entity whose market capitalization is almost entirely decoupled from its operational performance? It's a ghost in the machine, an analytical artifact left over from a model that can't comprehend what it's looking at.
A Mismatch in the Model
My analysis isn't a critique of MicroStrategy's strategy. That's a separate discussion about risk, conviction, and corporate governance. This is a critique of the analytical framework being applied to it. The tools of fundamental analysis—EPS forecasts, revenue growth, Zacks Ranks—are predicated on the idea that a company's value is derived from its ability to sell goods and services at a profit. That assumption is broken here. MicroStrategy isn't a software company with a Bitcoin investment; it's a Bitcoin trust with a legacy software business attached. Analyzing it as anything else is an exercise in futility. The numbers aren't wrong, the model is.